#
Percona Monitoring and Management (PMM)
PMM is an open source database observability, monitoring, and management tool for use with MySQL, PostgreSQL, MongoDB. It provides real-time visibility into the performance of your database and helps you identify and resolve issues before they impact your users.
#
Configuring PMM master server via TurboStack
To configure a PMM master server, you just need to add the following to your TurboStack config:
webserver: nginx
redis_enabled: false

system_users:
  - username: pmm
    vhosts:
      - server_name: pmm.yoursite.tld
        app_type: pmm
        cert_type: letsencrypt
        k8s_enabled: true
        app_install: true
Don't forget to configure the A and AAAA records of your server_name, before publishing.
#
Logging in to PMM
You can log in to PMM by going to https://pmm.yoursite.tld. The credentials for the pmmagent user can be found after clicking the Credentials button in the TurboStack GUI.
#
Connecting your server to the PMM master server
If you have a configured master server, you'll need to connect your TurboStack server to it in order for it to collect metrics.
#
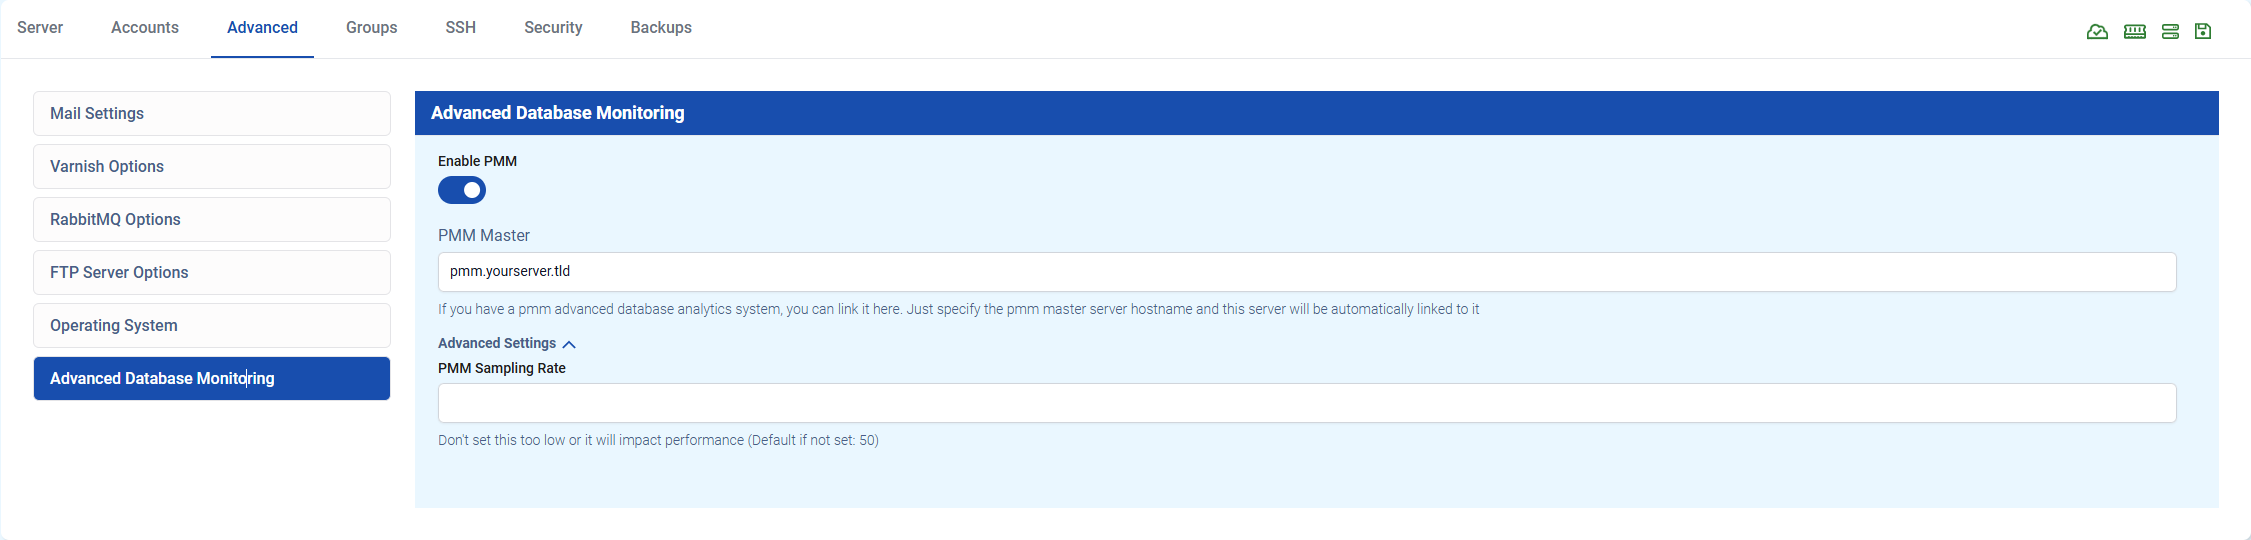
In the GUI
You can enable PMM in the TurboStack GUI under Advanced > Advanced Database Monitoring > Enable PMM. In this screen, you can fill in the hostname of the master server and, if you want, the sampling rate.
It's recommended to use the default sampling rate of 50. This value means it will collect metrics every Nth query. Lower values, will result in more data, but also more load on both servers.
#
In the YAML
You can also connect to the master server via YAML configuration. Add the following to your TurboStack config:
pmm_master:
  server_hostname: pmm.yourserver.tld