Health - server health and monitoring overview
The Health tab is your first stop when opening a host. It provides a real-time overview of the server's condition, surfaces the most important alerts, and gives you direct access to detailed monitoring reports and services.
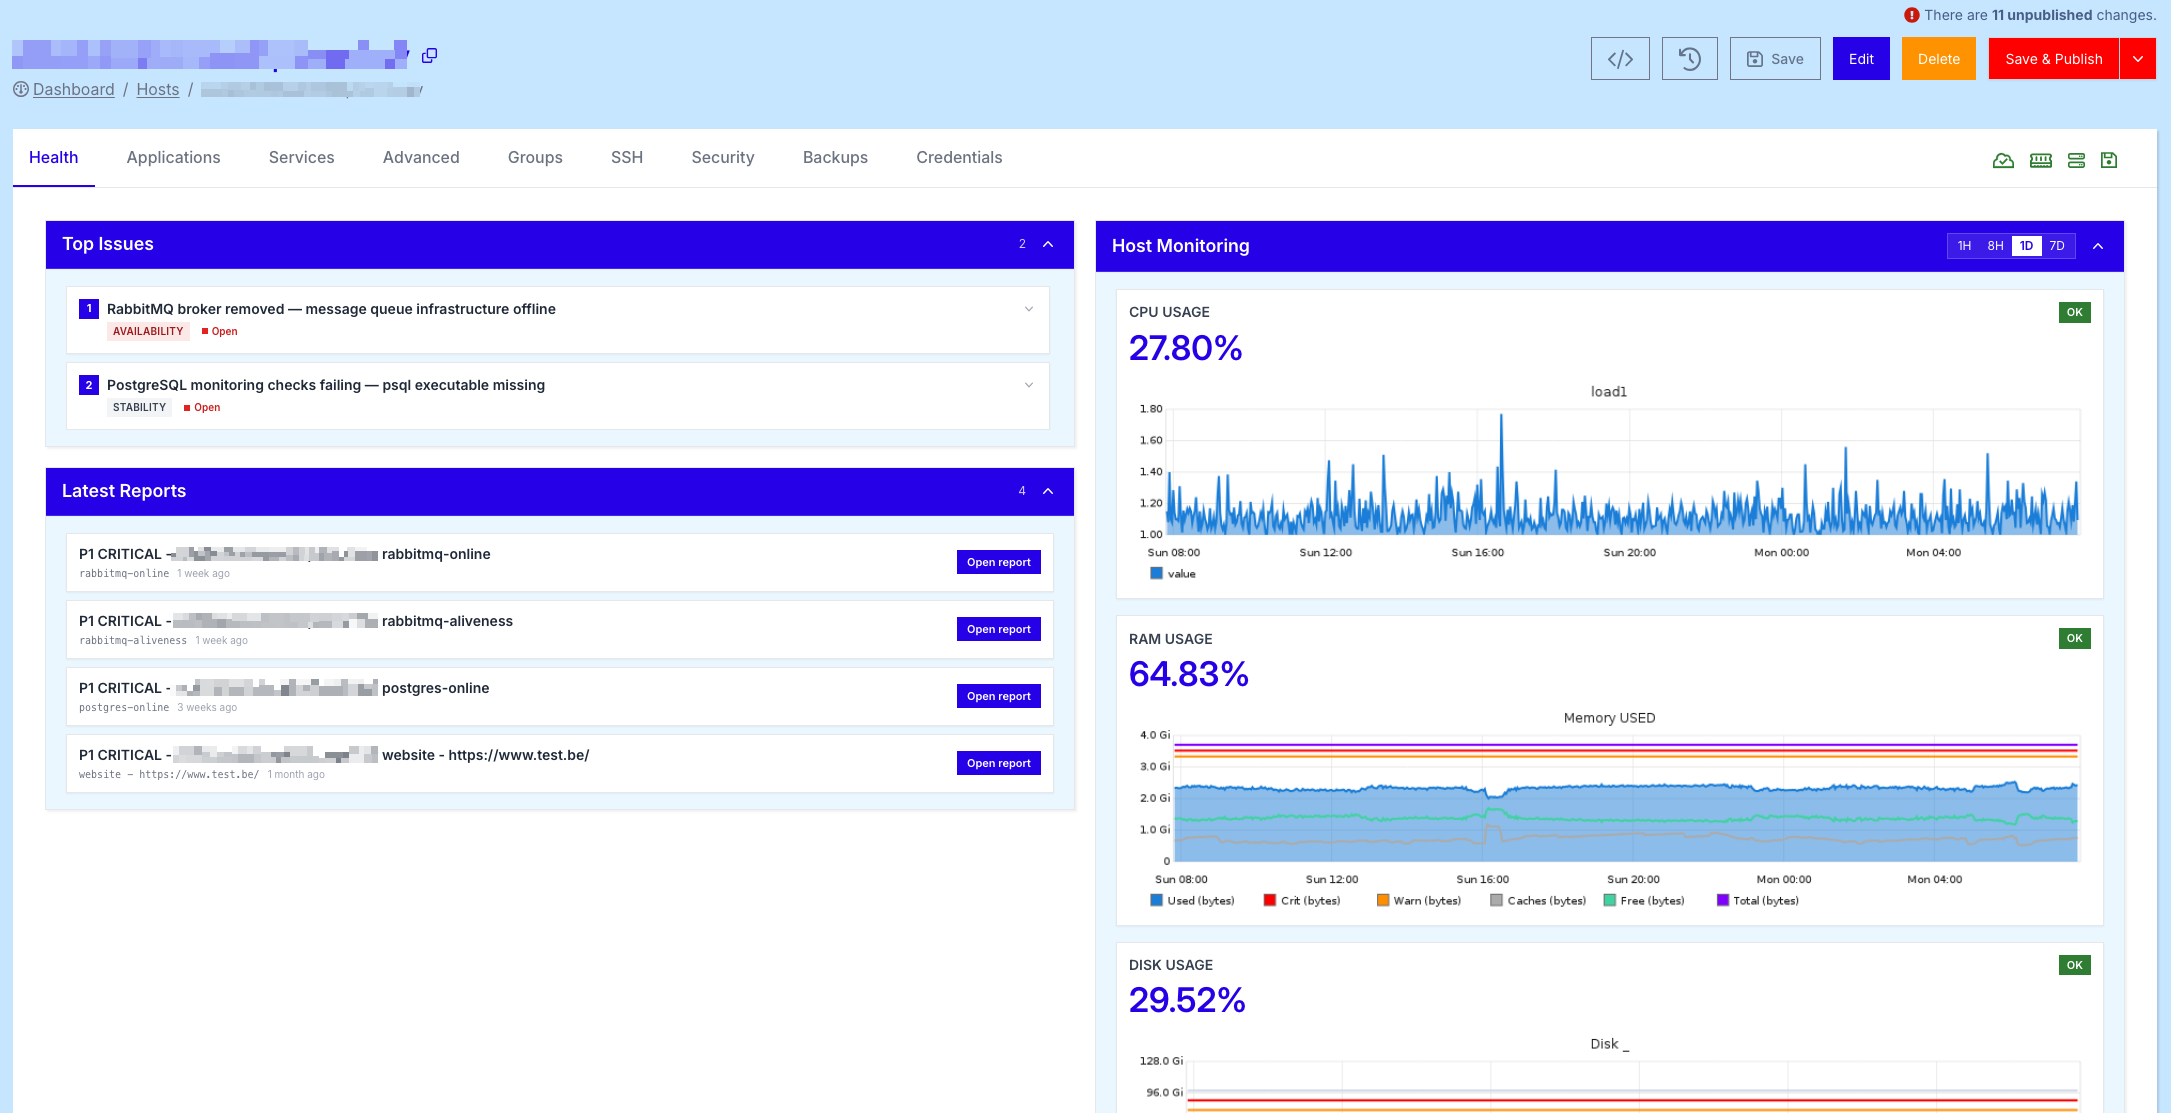
Unlike the fleet-wide Monitoring dashboard, the Health tab is fully scoped to a single host, giving you deep insight into how this specific server and its applications are behaving right now and over time.
What makes the Health tab particularly powerful is that it does not just show the status of your server - it actively helps you resolve issues. For every entry in Top Issues and every report under Latest Reports, the TurboStack platform provides a detailed analysis of the underlying problem, together with concrete, context-aware recommendations on how to fix it. This turns the Health tab from a passive status page into an actionable troubleshooting tool, helping you move from "something is wrong" to "here is exactly what to do about it" in a single click.
This page describes every section of the Health tab and how to use it to keep your infrastructure running smoothly.
Host Monitoring
The Host Monitoring panel, located on the top right, displays the most important resource metrics of your server at a glance:
- CPU Usage - the current CPU load, accompanied by a graph showing the
load1average over time. - RAM Usage - the current memory consumption, with a detailed breakdown of used, free, cached, warning and critical thresholds.
- Disk Usage - the current disk consumption on the root filesystem, plotted against warning and critical thresholds.
Each metric is shown as a percentage, combined with a colour-coded status indicator (OK, Warning, Critical) so you can immediately spot any resource that needs attention.
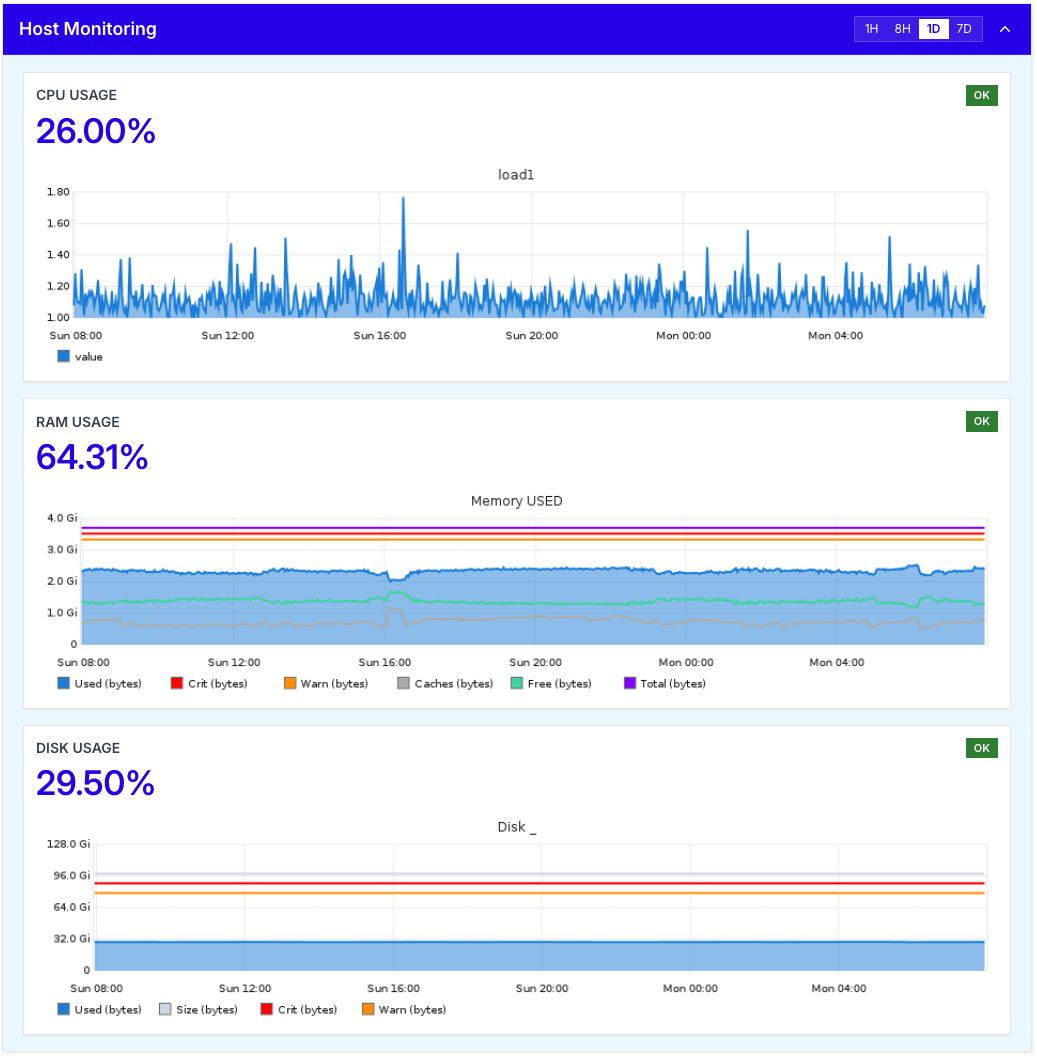
Timeframe selector
In the top right corner of the Host Monitoring panel, you can switch the timeframe of the graphs between 1H, 8H, 1D and 7D. This allows you to quickly zoom in on a recent spike or zoom out to identify longer-term trends in resource usage.
info
The Host Monitoring graphs are based on the same data used by our 24/7 monitoring system. If a metric crosses a critical threshold, our team will be alerted automatically.
Top Issues
The Top Issues panel, on the top left, lists the most important active alerts on your server right now. Each issue is tagged with a category (e.g. AVAILABILITY, STABILITY, PERFORMANCE) and a status (e.g. Open).
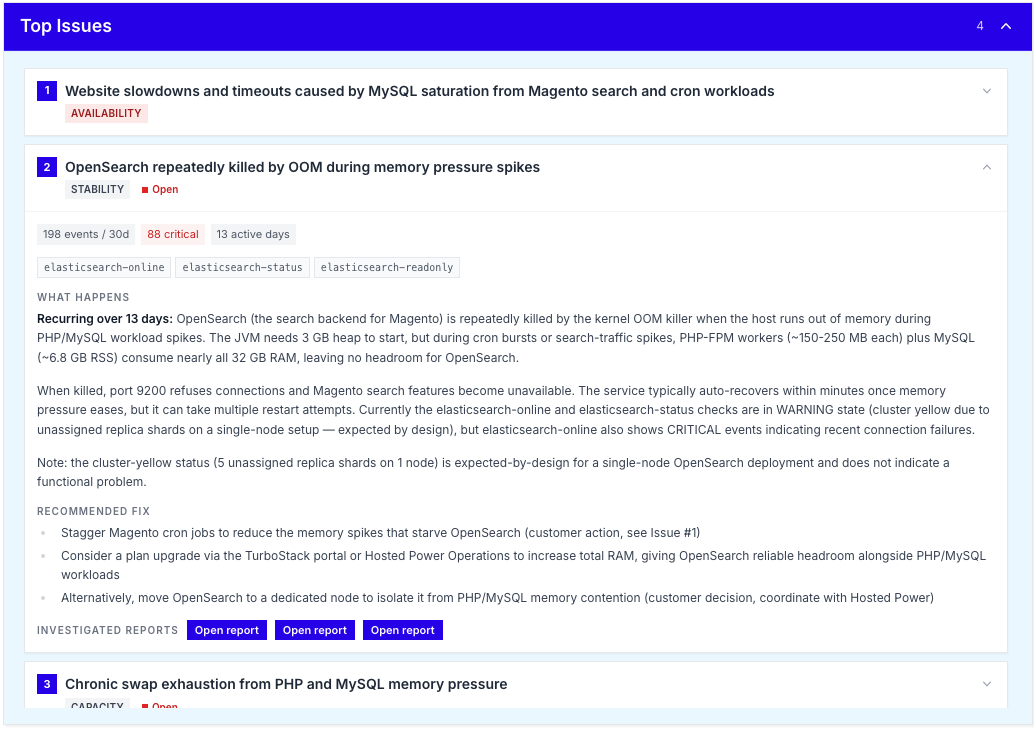
Clicking an issue expands it, revealing:
- A detailed description of the problem, including the affected service and the impact on your environment.
- A proposed solution suggested by the TurboStack platform, based on the type of issue and the server's configuration.
This makes it easy to understand what is wrong, why it matters, and what to do next, without having to dig through logs or external dashboards.
Latest Reports
Below the Top Issues panel, the Latest Reports section provides a chronological list of detailed health reports generated for the server and its applications.
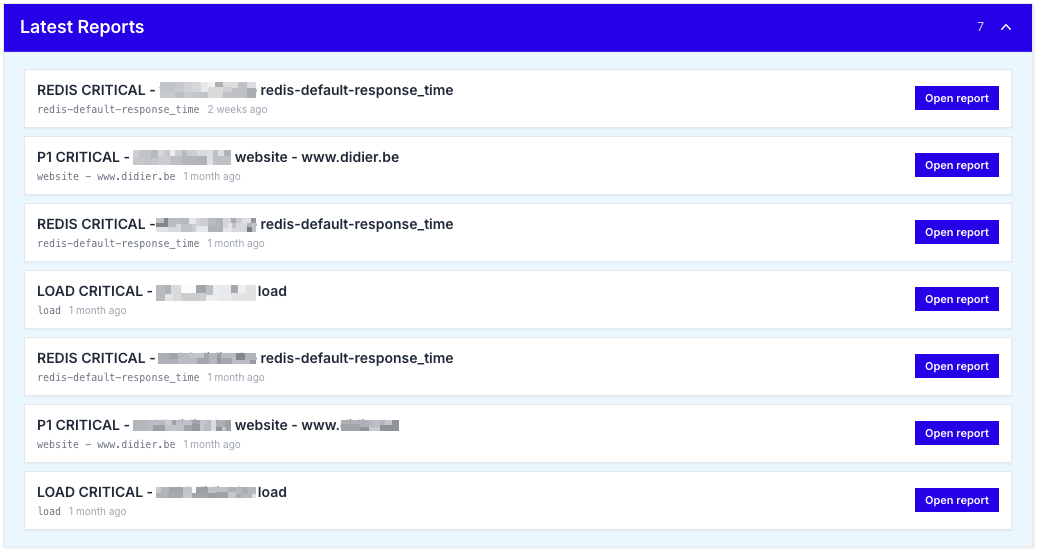
Each report is linked to a specific check (e.g. rabbitmq-online, postgres-online, website) and includes the severity level (e.g. P1 CRITICAL), the affected host or URL and the time the report was generated.
Click Open report on any entry to view the full report, including timestamps, related metrics and historical context. This is particularly useful when investigating incidents or preparing a post-mortem.
Services
At the bottom of the Health tab, the Services panel shows a complete list of every monitored service on the server, together with its current status and the latest check output.
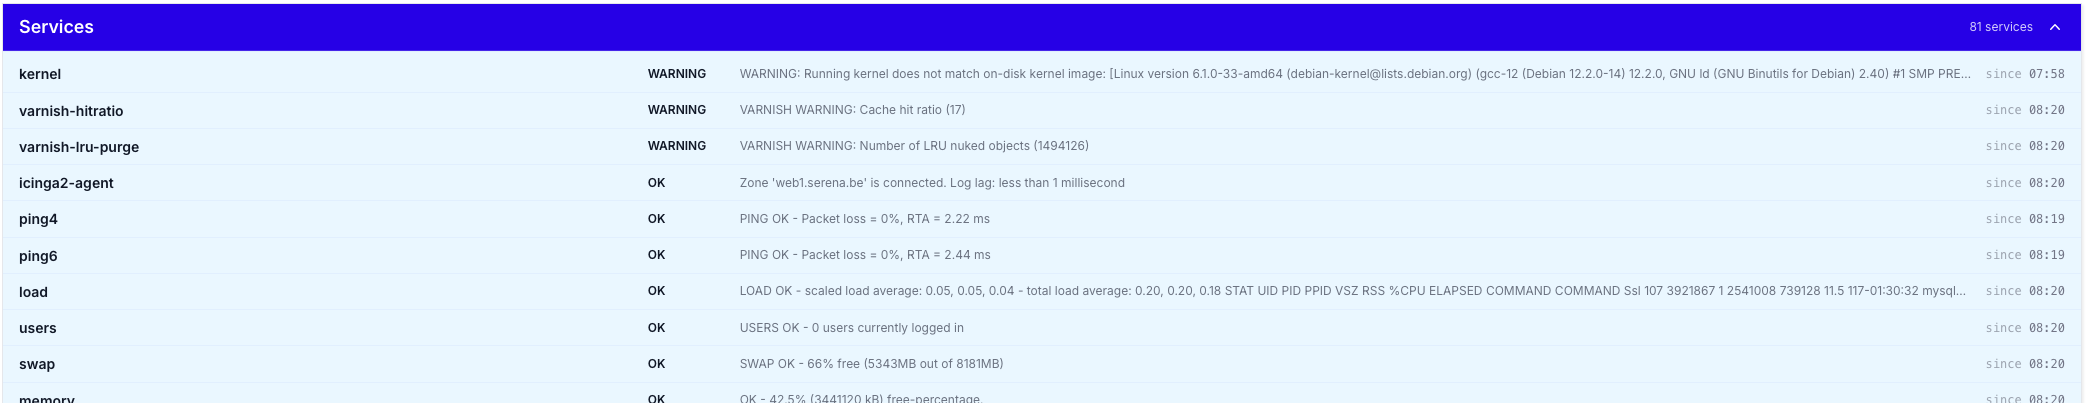
For each service you will see:
- The service name (e.g.
postgres-online,ping4,disk /,smtp,mysql-uptime). - The status (
OK,WARNING,CRITICAL,UNKNOWN). - The plugin output, which contains the raw result of the check (e.g. response times, free disk space, error messages).
- The timestamp of the most recent check.
This view gives you an exhaustive overview of everything we monitor on your server, making it easy to confirm that all services are healthy or to drill down into a specific check that is failing.
info
If a service is in an UNKNOWN or CRITICAL state and you are not sure how to resolve it, please contact our Support team. Our engineers have access to the same monitoring data and can intervene 24/7. See our 24/7 monitoring and alerting overview for how this works.