
Deploy PMM on TurboStack
Percona Monitoring and Management (PMM) is the advanced database monitoring TurboStack offers. We run it unmodified. In the TurboStack interface it is called Advanced Database Monitoring.
Ordinary monitoring tells you that a database is busy. PMM tells you what is making it busy, down to the individual query.
It is built for finding and fixing performance problems. You start at the level of all your monitored servers, see which one is under load, and drill down to the single query responsible. Queries are ranked by the load they cause, not by how slow a single run was. PMM also flags patterns that deviate from normal, so a problem surfaces before someone reports it. The dashboards go into engine-specific detail: InnoDB behavior on MySQL, tuple activity on PostgreSQL. That is where you look once you know which query to chase. It is not a general server monitor: host health and alerting stay in Health and Monitoring.
What it gives you
Advanced database monitoring. An agent on each server collects the host's own metrics (CPU, memory, disk, network) and the database's internals: connections, buffer pool, locks, replication and throughput. These arrive as prepared dashboards, so you can see a problem develop over time instead of only at the moment someone reports it.
Query Analytics. This is the part you cannot get from Health or the Monitoring alerts. It lists your queries ranked by the time they actually cost, so the query that runs ten thousand times a minute ranks above the one slow report nobody runs. Per query you get how often it ran, its average and worst execution time, the share of total database time it accounts for, and the full query text. That turns "the site is slow" into "this query, this table, this index".
Where the query data comes from depends on the engine:
Query text is never truncated, so a long query is still readable in the dashboard.
How it is put together
PMM has two halves, and they are set up separately:
-
The monitoring master - one server that stores the metrics and serves the dashboards. Hosted Power sets this up as an application (
app_type: pmm). -
The monitored servers - every host whose databases you want to see. You switch these on yourself, in the interface.
1. The monitoring master
The master runs on a Kubernetes cluster and keeps a large volume for its time-series data.
Important
Like GitLab, this is not in the App Type list you can pick from yourself. Contact Support to have a monitoring master set up, and to agree its hostname and volume size.
app_type: pmm
pmm_volume_size: 500 # gigabytes for the metrics volumeMetrics are kept for 10 days. Automatic updates and telemetry are switched off, so the master only does what you deploy it for.
Once it is running, its dashboard is on the hostname you agreed, for example
https://pmm.example.com.
2. The servers you want to monitor
This half is self-service, on every host you want to see. Open the host, go to Advanced > Advanced Database Monitoring, and turn it on.
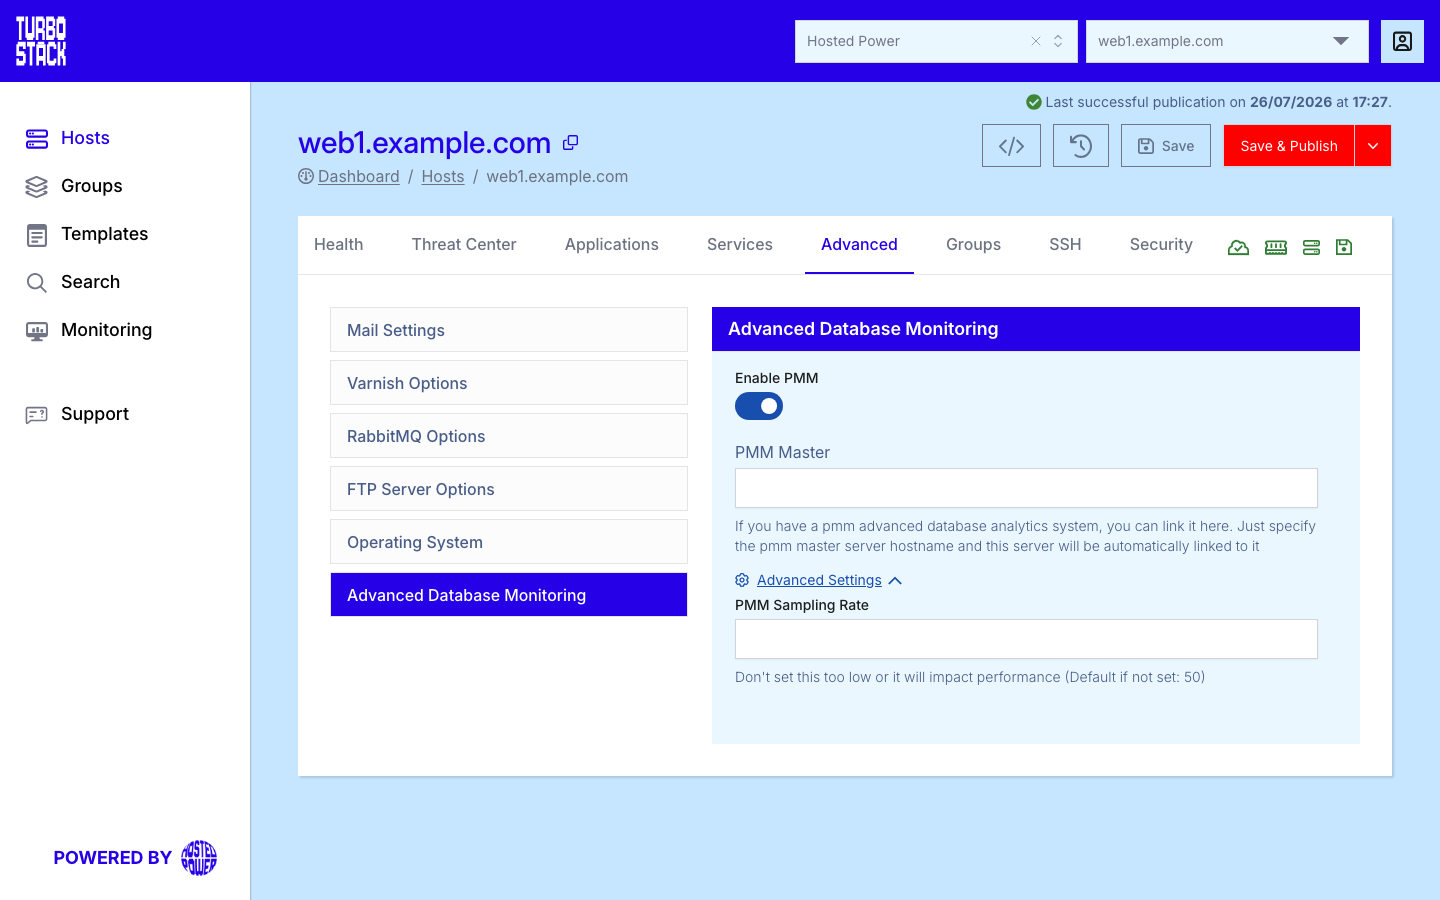
Or in YAML:
pmm_master:
  server_hostname: pmm.example.com
Publishing installs the monitoring agent on the host and registers it with the master, which then starts collecting from the databases it finds. Removing the setting unregisters the host again and removes the agent.
Tip
Keep the sampling rate at 50 unless you have a reason to change it. A lower number logs more
queries, which gives finer Query Analytics but adds load on the monitored server and the master.
3. Open the dashboards
Sign in at the master's address with the pmmagent user. Its password is behind the
Credentials button on the host in the TurboStack interface.
Start in Query Analytics when a site is slow but the database looks healthy: sort by total time, open the top query, and read its examples and the tables it touches.
Related
- Applications overview
- Monitoring - all the monitoring TurboStack offers
- Advanced settings - the tab this lives on
- MySQL and PostgreSQL
- Deploy GitLab - the other platform Hosted Power runs for you