
Logs
The host's Logs tab shows the logs of your server inside the TurboStack Platform. You pick a log, a time range and search words, and the newest matching lines appear with their time and a status or level. No SSH session and no log file paths are needed.
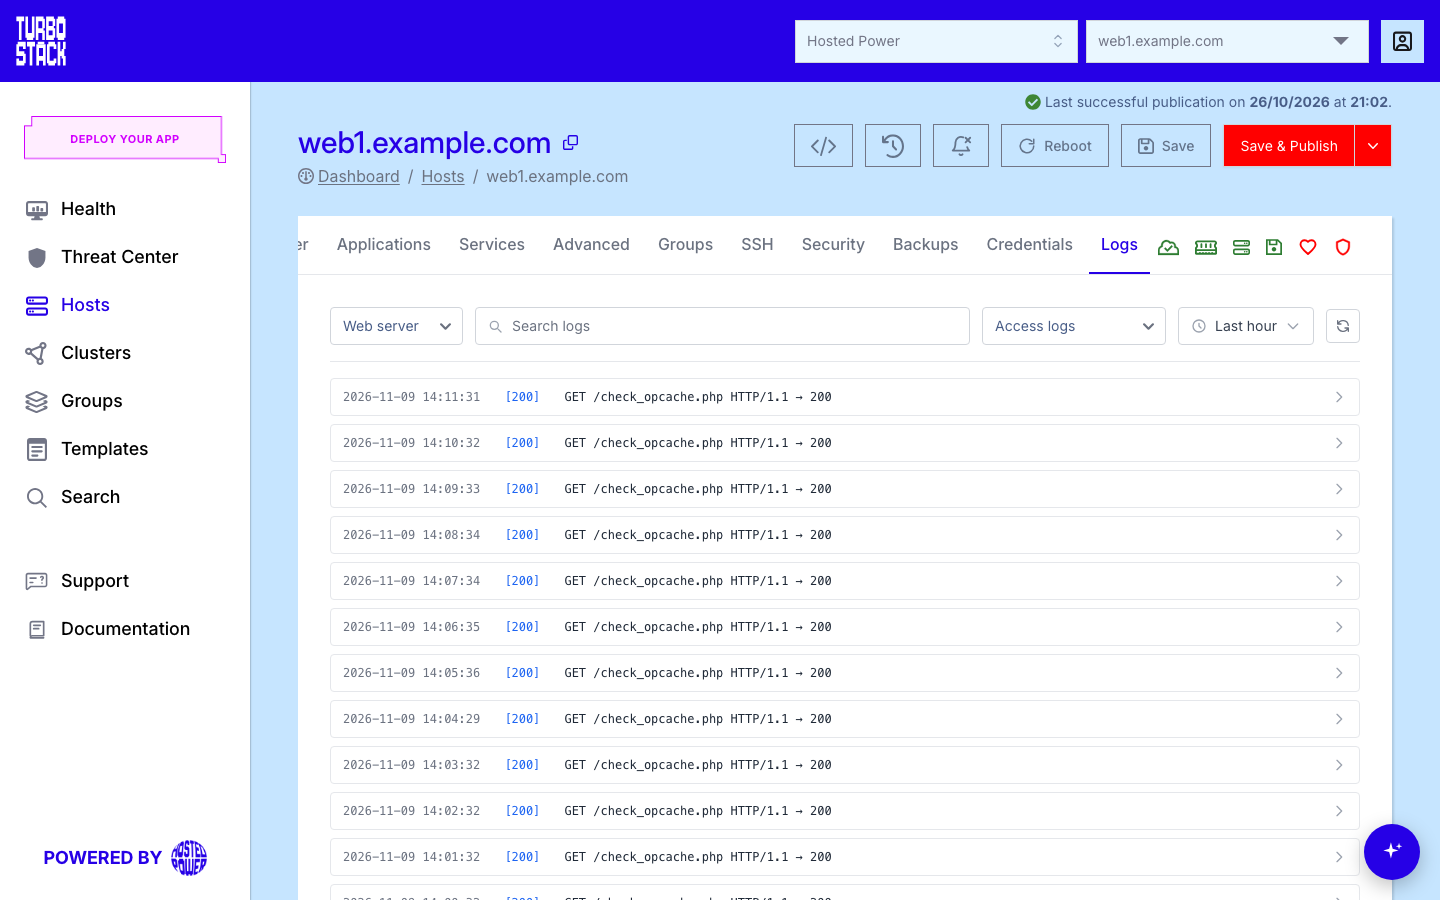
This tab covers:
Opening the tab - how the connection to the server worksChoosing a log - which logs you can read and what each containsAccess and error logs - the two parts of a web server logTime ranges - the fixed ranges and a custom start and endSearching - how search words are matchedReading the lines - what the badge means and how to load moreLog details - the full line and its context fieldsApplication service logs - the logs of your own servicesThe same logs from the command line -tscli logs
Note
The Logs tab is available on TurboStack hosts. It does not appear on cPanel, DirectAdmin or Windows hosts.
Opening the tab
Open a host and click Logs (the rightmost tab, also reachable as #logs in the address bar). The tab connects to your server on its own and shows Fetching logs... while it reads the first lines. The connection is temporary and expires after about 15 minutes. When that happens, or when the server cannot be reached, the tab shows a message and a Try again button.
If the message The logs could not be fetched remains after a retry, wait a minute and try again. If it persists, contact Hosted Power support.
Choosing a log
The first dropdown selects the log. Web server is selected when the tab opens. The platform reads the current log file and its rotated copies, so a 30-day range also covers lines that were already rotated away.
The lines of every log show the time the server wrote them, in server time.
Access and error logs
A web server keeps two logs. The access log has one line per request, with the HTTP method, the path and the status code. The error log has the problems the web server encountered while serving requests. Examples are a backend that did not answer, a blocked request, or a PHP error forwarded by the application.
With Web server, Nginx or Apache selected, a second dropdown picks the part you want:
- Access & error logs (the default) shows both, sorted by time.
- Access logs shows only the requests.
- Error logs shows only the error lines.
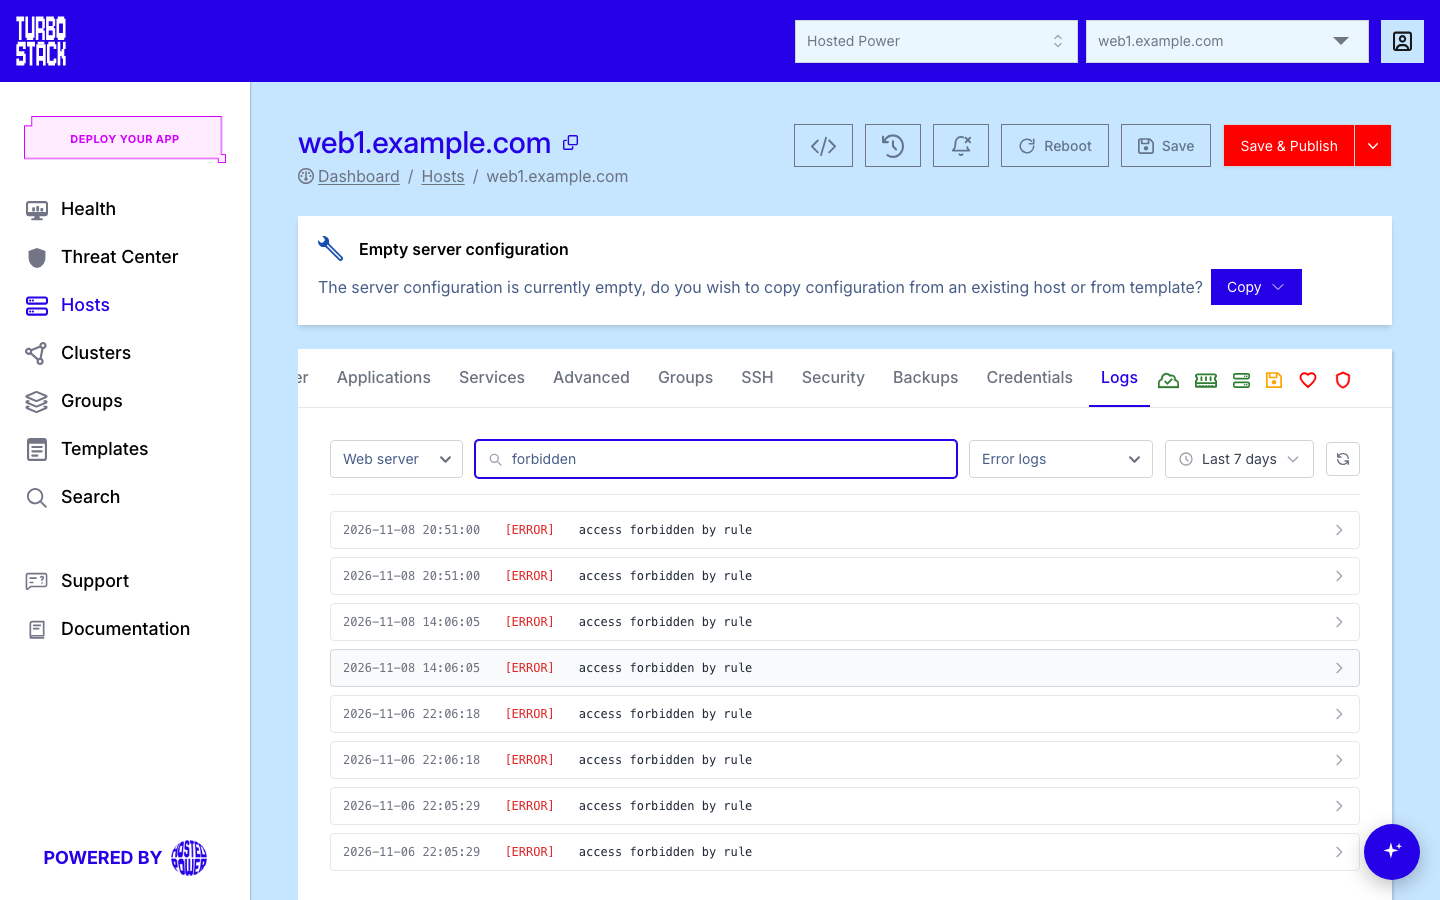
The other logs have one part only, so the dropdown is not shown for them.
Time ranges
The clock button on the right shows the active range, Last hour when the tab opens. Click it to choose another range:
- Last 5 minutes, Last hour, Last 6 hours, Last day, Last 7 days or Last 30 days, counted back from now.
- A custom range: fill in a Starting date and, if you want, an Ending date, then click Apply. Both are in server time, to the minute. Without an ending date the range runs until now. The ending date must come after the starting date.
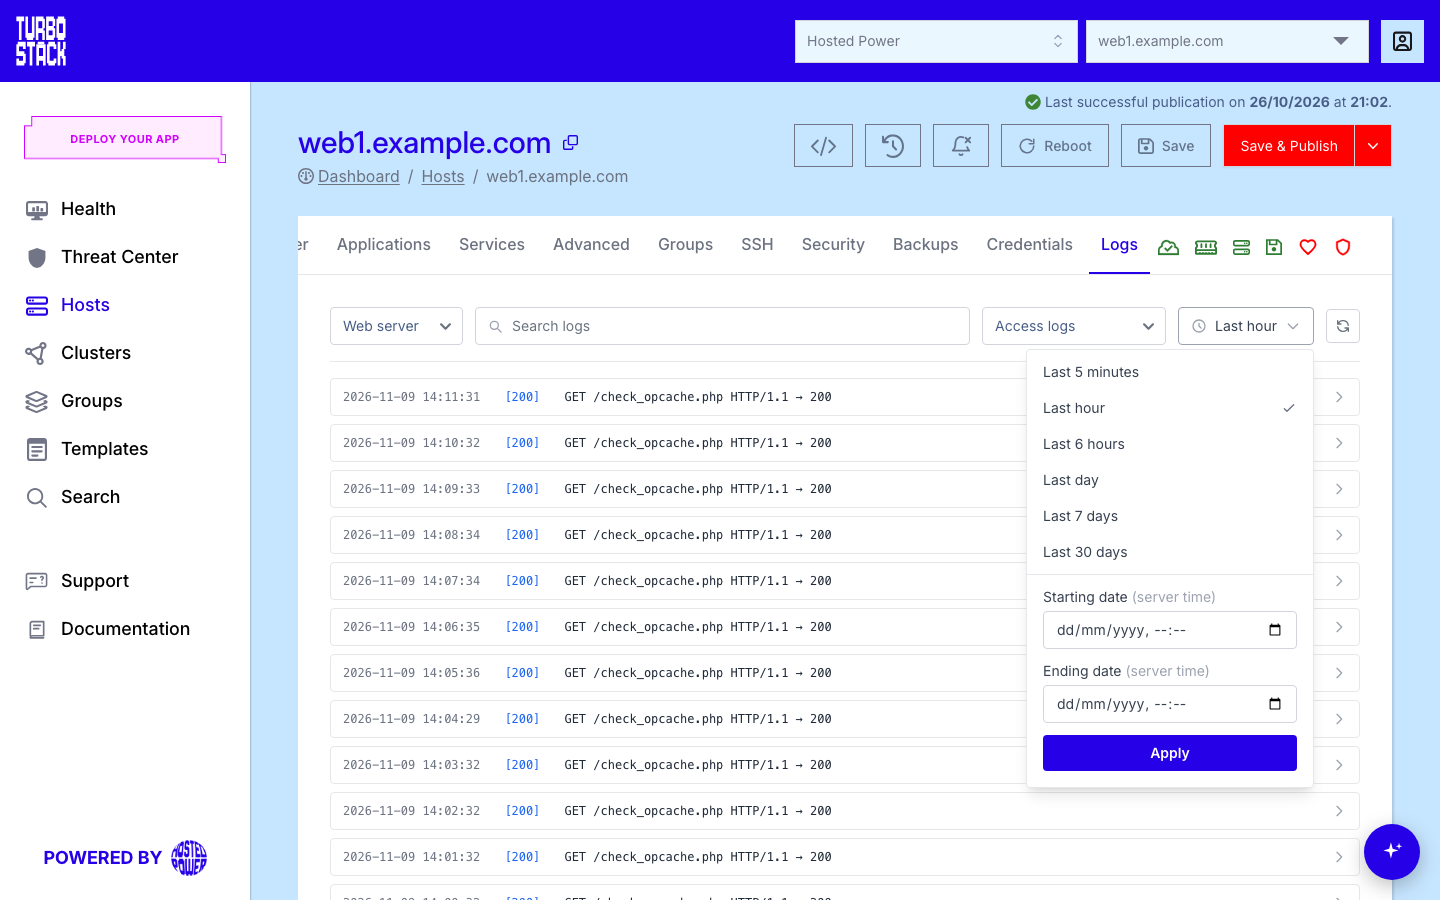
Pick the smallest range that covers the moment you investigate. A short range loads faster, and the lines you need are not replaced by newer ones.
Searching
Type one or more words in Search logs. The list reloads about a second after you stop typing. The rules:
- Every word must appear in the line.
git configshows only lines that contain bothgitandconfig. - Put
orbetween words to match either of them.timeout or refusedshows lines that contain one of the two. - The whole line is searched, not only the text shown in the list. For a web request that includes the client address, the referrer and the browser's user agent. So a search for a path such as
/checkout, or for a client address, works even when the list shows only the request. - Letter case does not matter.
- A status code on its own is ignored. The number
404by itself matches nothing extra. Type404 errors(or500 errors,403 errors) to filter on that HTTP status code. Several codes next toerrorsmatch any of them. ERROR,WARNING,CRITICAL,FATAL,EXCEPTIONandFAILEDmatch lines with that severity.- A search is limited to 200 characters.
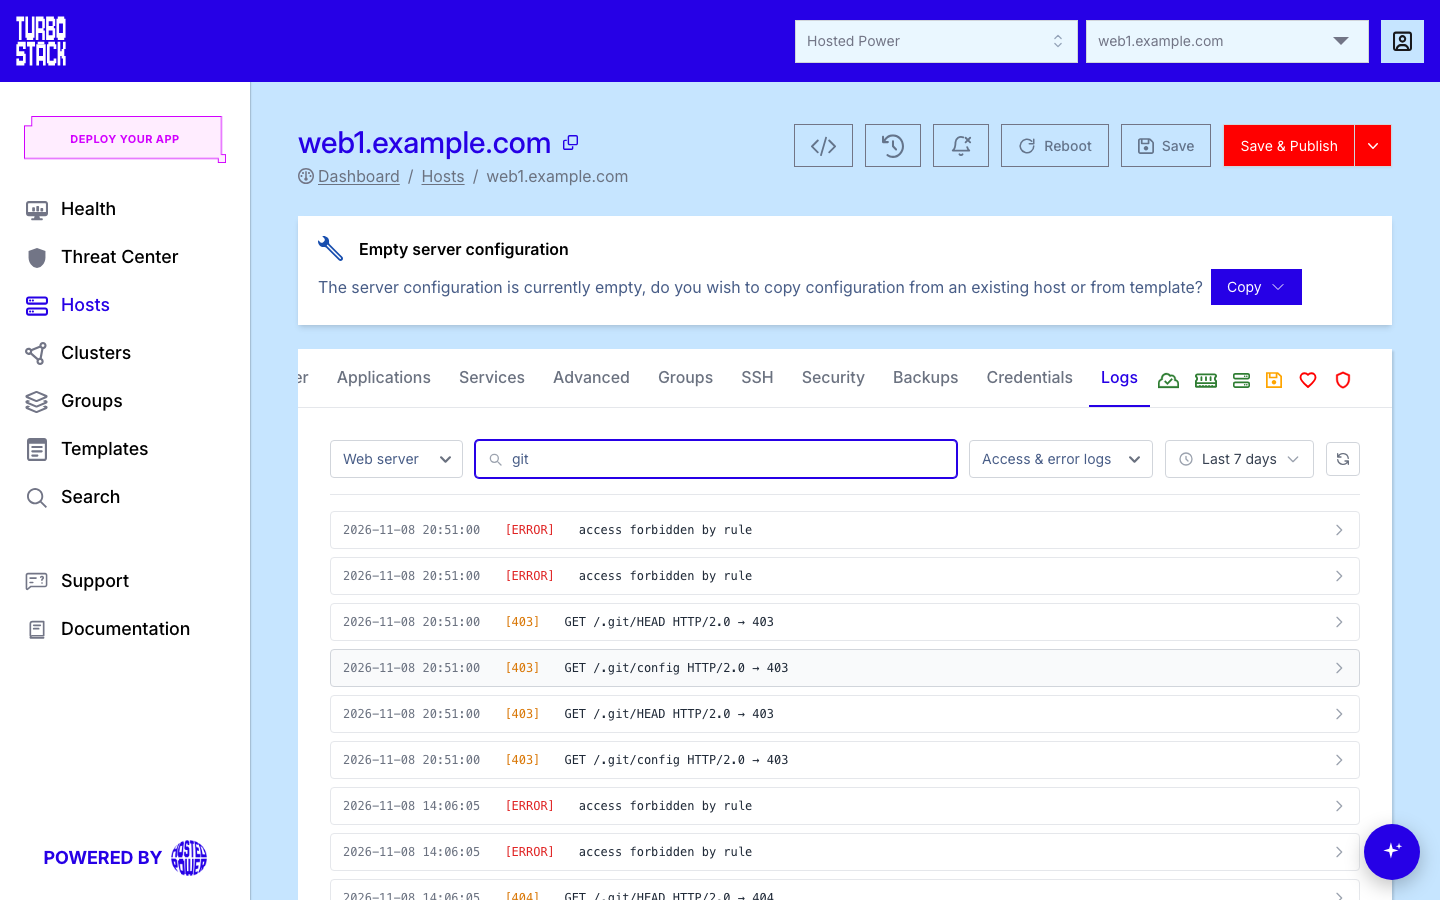
When no line matches, the list shows No log lines found for these filters. Widen the time range or remove a word.
Reading the lines
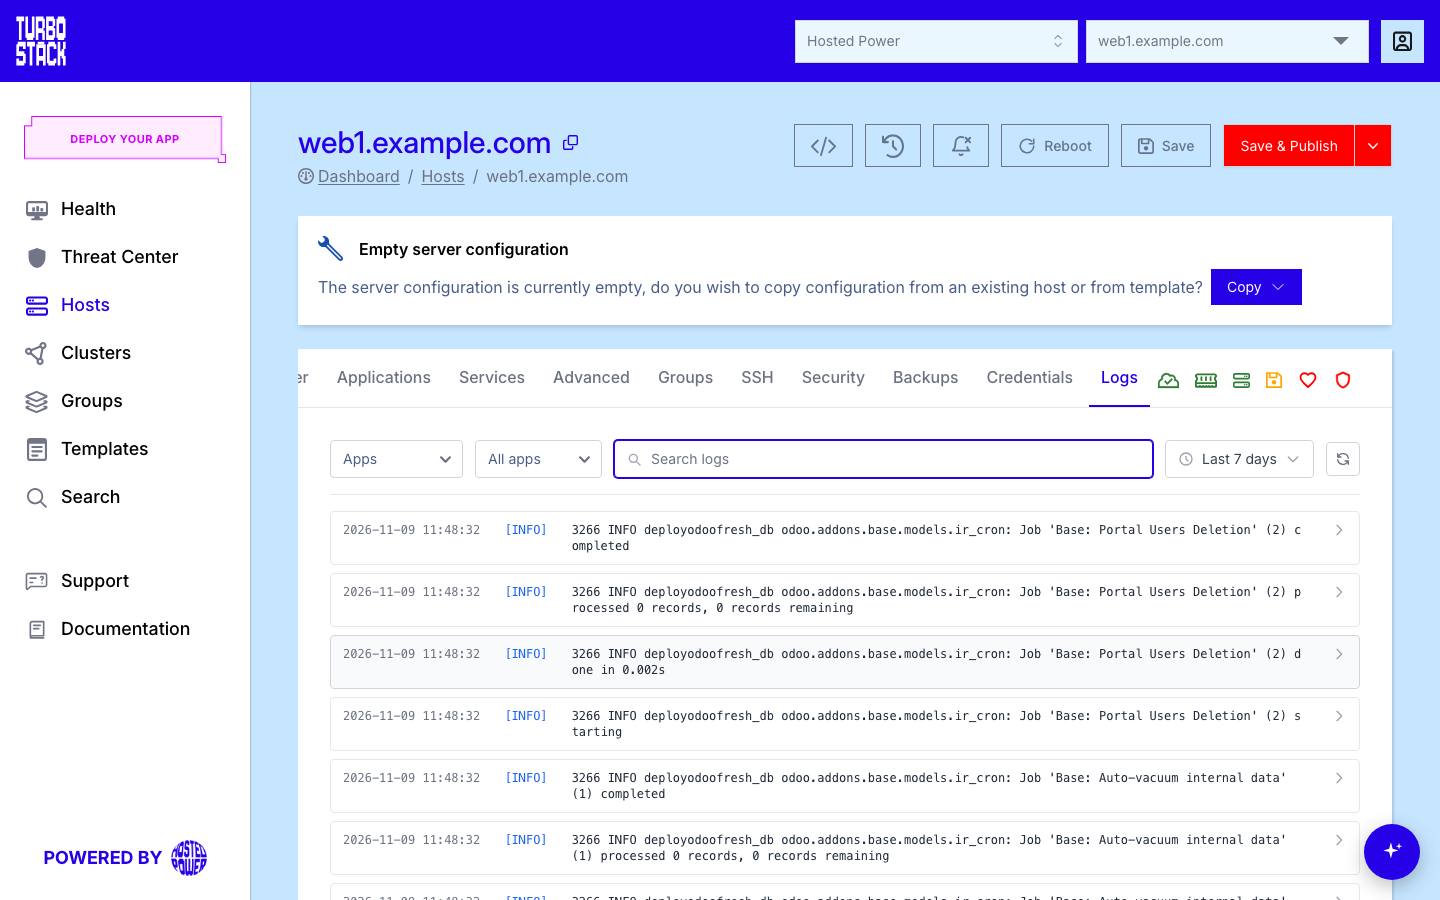
The newest line is at the top. Each line shows the server time, a badge and the message:
- For a request from the access log the badge is the HTTP status code: blue for 2xx and 3xx, amber for 4xx and red for 5xx.
- For every other line the badge is the level:
[INFO],[WARN]or[ERROR]. It is taken from the line itself. When the line names no level, it is guessed from words such as error or warning.
A multi-line entry such as a stack trace shows its first line in the list and the rest in the details.
The tab reads the 100 newest lines of the selected log for the chosen range and filters. When older lines exist, a Load older button appears below the list. Each click adds 100 more, up to 3,000 lines. When the web server log is shown with both parts, each part has its own count, so the list can hold up to twice that. Use the Refresh button next to the time range to read the newest lines again with the same filters.
Log details
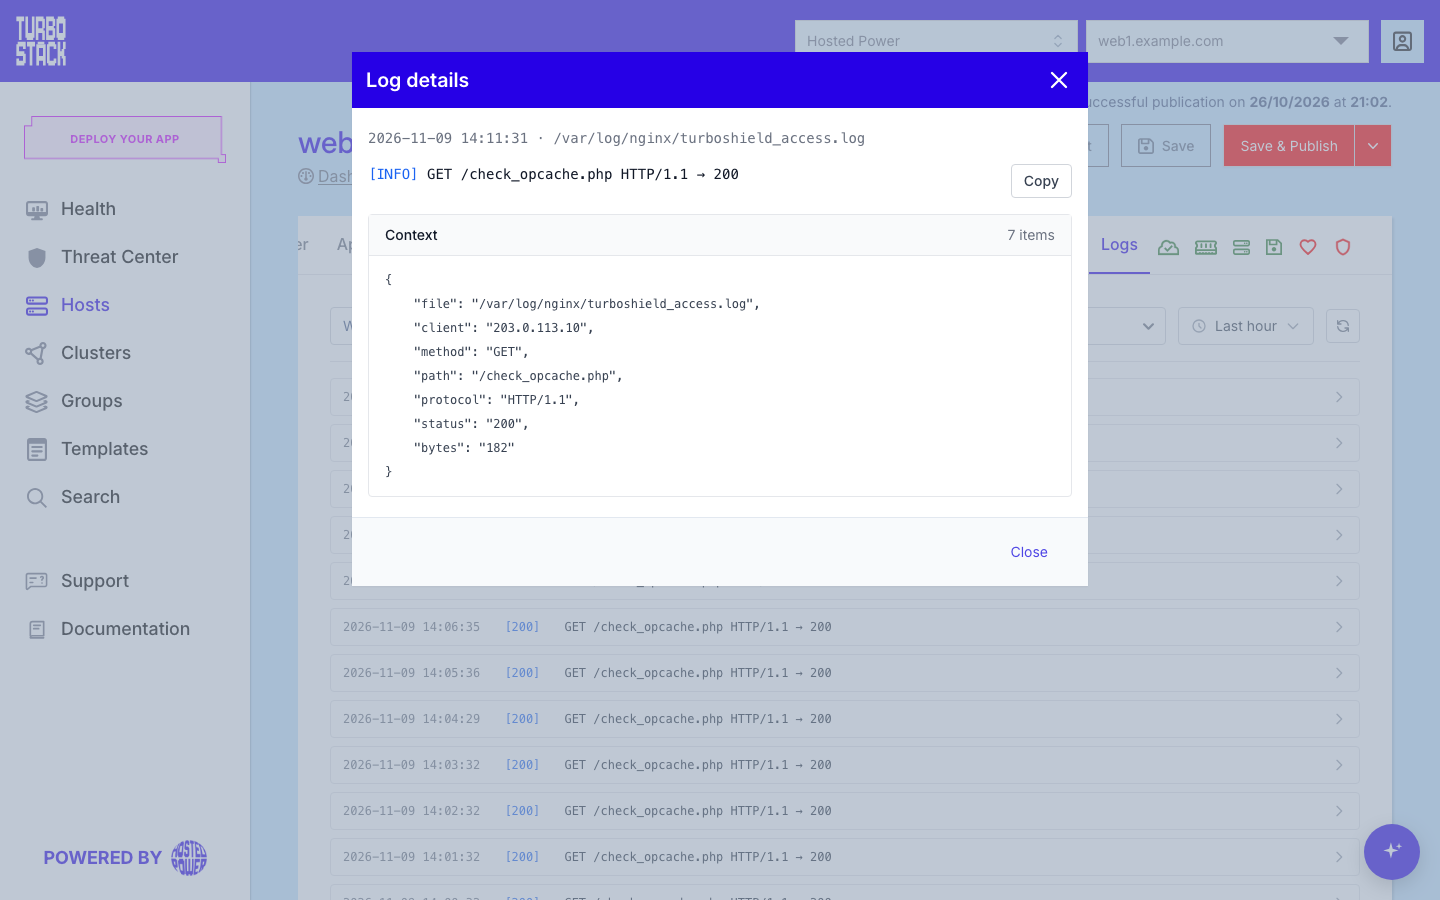
Click a line to open Log details. The popup shows:
- The server time and the file the line was read from.
- The full message, with every line of a multi-line entry.
- A Copy button that copies the raw log line as it is in the file, for a ticket or a colleague.
- Context: the fields the platform recognized in the line. For a web request these are the client address, method, path, protocol, status, bytes sent, referrer and user agent. For a web server error they include the level, the client, the server name and the request. When a backend was involved, the upstream is listed too. For other logs they include the program and process id, when the line names them.
Application service logs
Choose Apps to read the logs of the services you run under your own system users: queue workers, schedulers, a Node.js or Python process and similar. These are the services described in Manage user services. Their output is read from the service journal and from the log files the service writes to.
A second dropdown lists the services found on the host. All apps (the default) shows every service together. Pick a service to show only its lines.
When the host runs no application services, the list stays empty.
The same logs from the command line
The Logs tab reads the server through the TurboStack CLI. Everything you select in the tab has a tscli logs equivalent, which you can run over SSH with your system user and its password from the Credentials tab:
Over SSH you see the logs of your own system user. The Logs tab shows the logs of every system user on the host. A line from another account's application is therefore visible in the tab, but not on the command line of your account.